Correlation and partial correlation networks (also called Gaussian graphical models, GGMs).
Usage
cor_network(
  data,
  index = c("cor", "pcor"),
  show.value = TRUE,
  show.insig = FALSE,
  show.cutoff = FALSE,
  faded = FALSE,
  node.text.size = 1.2,
  node.group = NULL,
  node.color = NULL,
  edge.color.pos = "#0571B0",
  edge.color.neg = "#CA0020",
  edge.color.non = "#EEEEEEEE",
  edge.label.mrg = 0.01,
  title = NULL,
  file = NULL,
  width = 6,
  height = 4,
  dpi = 500,
  ...
)
Arguments
- data
Data.
- index
Type of graph:
"cor"(raw correlation network) or"pcor"(partial correlation network). Defaults to"cor".- show.value
Show correlation coefficients and their significance on edges. Defaults to
TRUE.- show.insig
Show edges with insignificant correlations (p > 0.05). Defaults to
FALSE. To change significance level, please setalpha(defaults toalpha=0.05).- show.cutoff
Show cut-off values of correlations. Defaults to
FALSE.- faded
Transparency of edges according to the effect size of correlation. Defaults to
FALSE.- node.text.size
Scalar on the font size of node (variable) labels. Defaults to
1.2.- node.group
A list that indicates which nodes belong together, with each element of list as a vector of integers identifying the column numbers of variables that belong together.
- node.color
A vector with a color for each element in
node.group, or a color for each node.- edge.color.pos
Color for (significant) positive values. Defaults to
"#0571B0"(blue in ColorBrewer's RdBu palette).- edge.color.neg
Color for (significant) negative values. Defaults to
"#CA0020"(red in ColorBrewer's RdBu palette).- edge.color.non
Color for insignificant values. Defaults to
"#EEEEEEEE"(transparent grey).- edge.label.mrg
Margin of the background box around the edge label. Defaults to
0.01.- title
Plot title.
- file
File name of saved plot (
".png"or".pdf").- width, height
Width and height (in inches) of saved plot. Defaults to
6and4.- dpi
Dots per inch (figure resolution). Defaults to
500.- ...
Arguments passed on to
qgraph().
Value
Return a list (class cor.net) of (partial) correlation results and qgraph object with its grob (Grid Graphical Object).
Examples
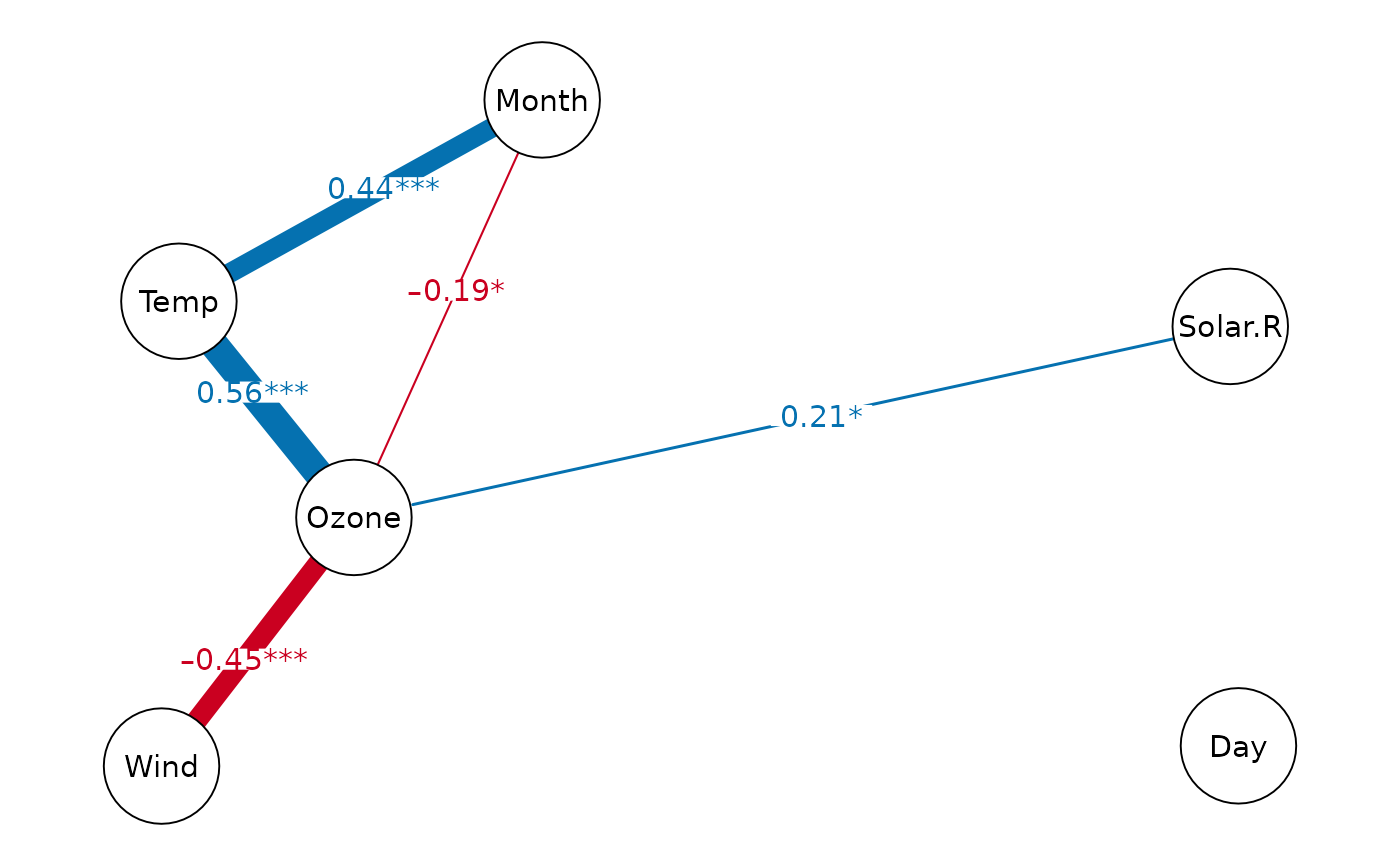
# correlation network
cor_network(airquality)
#> Displaying Correlation Network
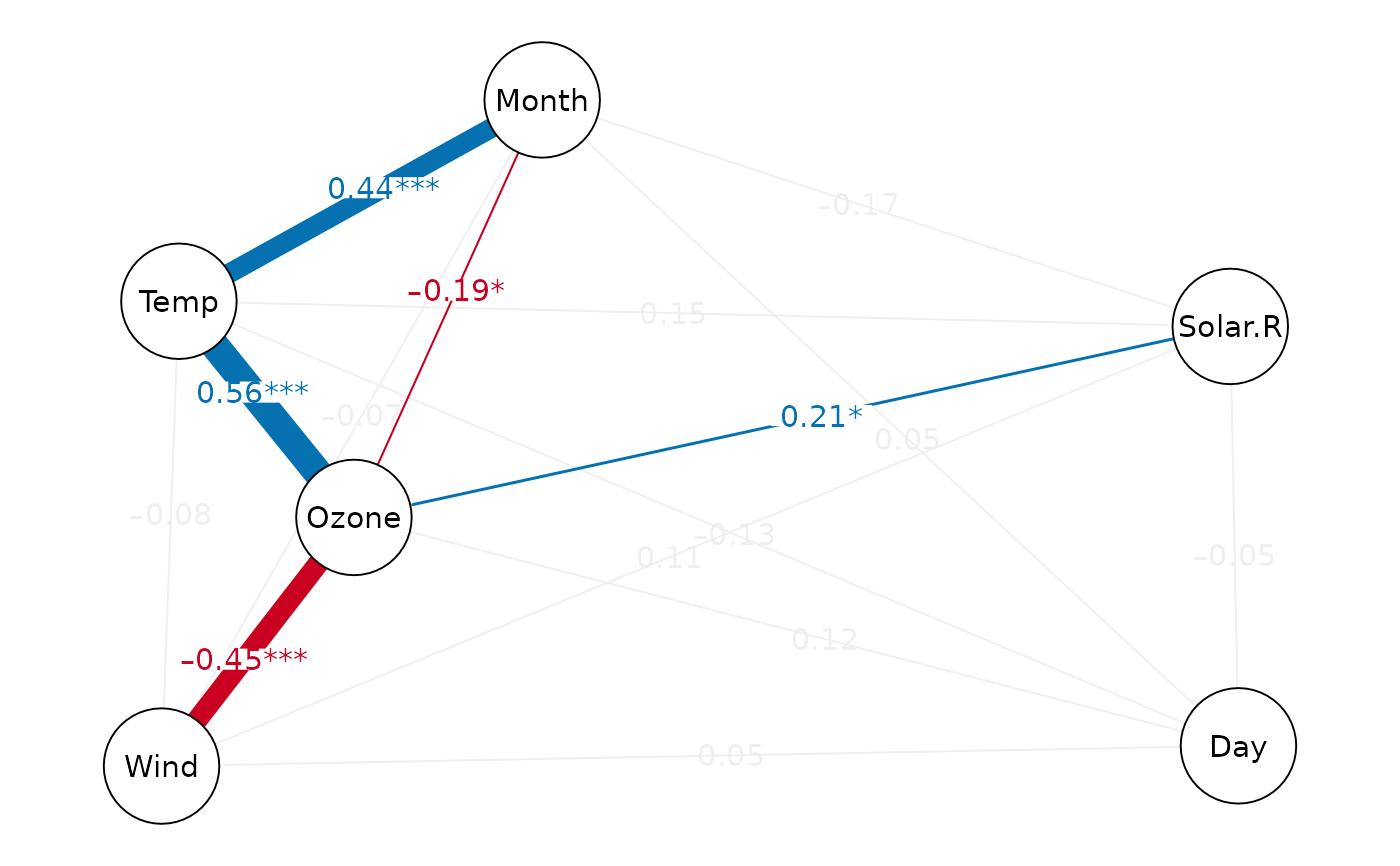
 cor_network(airquality, show.insig=TRUE)
#> Displaying Correlation Network
cor_network(airquality, show.insig=TRUE)
#> Displaying Correlation Network
 # partial correlation network
cor_network(airquality, "pcor")
#> Displaying Partial Correlation Network
# partial correlation network
cor_network(airquality, "pcor")
#> Displaying Partial Correlation Network
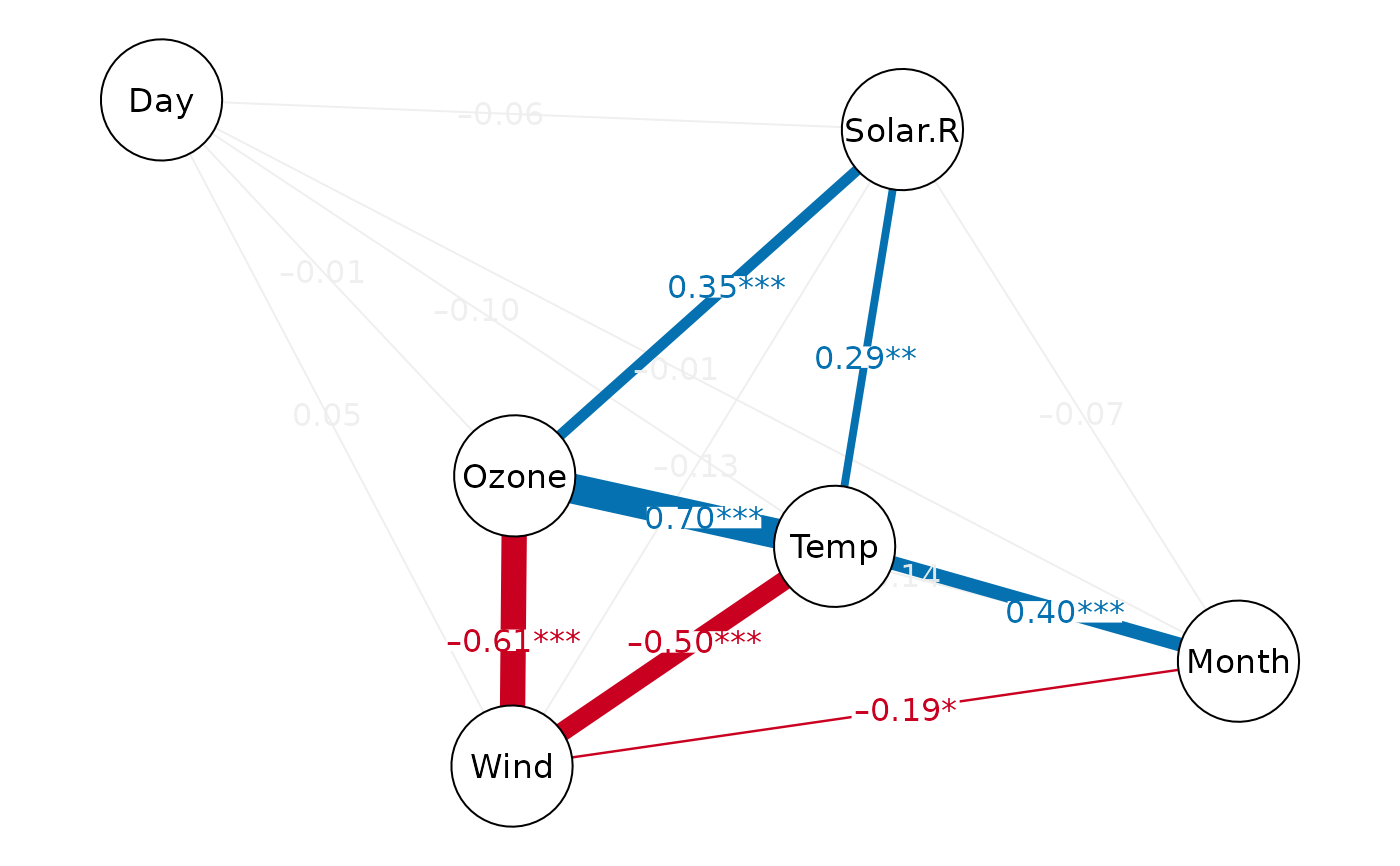
 cor_network(airquality, "pcor", show.insig=TRUE)
#> Displaying Partial Correlation Network
cor_network(airquality, "pcor", show.insig=TRUE)
#> Displaying Partial Correlation Network